\[x \cdot \frac{\frac{y}{z} \cdot t}{t}\]
Test:
Graphics.Rendering.Chart.Backend.Diagrams:calcFontMetrics from Chart-diagrams-1.5.1
Bits:
128 bits
Bits error versus x
Bits error versus y
Bits error versus z
Bits error versus t
Time: 7.0 s
Input Error: 14.2
Output Error: 0.9
Log:
Profile: 🕒
\(\begin{cases} \frac{y \cdot x}{z} & \text{when } \frac{\frac{y}{z} \cdot t}{t} \le -1.757933118989357 \cdot 10^{+195} \\ x \cdot \frac{y}{z} & \text{when } \frac{\frac{y}{z} \cdot t}{t} \le -7.923790622593908 \cdot 10^{-262} \\ \frac{y}{\frac{z}{x}} & \text{when } \frac{\frac{y}{z} \cdot t}{t} \le 4.0665267137974 \cdot 10^{-223} \\ x \cdot \frac{y}{z} & \text{when } \frac{\frac{y}{z} \cdot t}{t} \le 5.383776217840303 \cdot 10^{+282} \\ \left(x \cdot y\right) \cdot \frac{1}{z} & \text{otherwise} \end{cases}\)

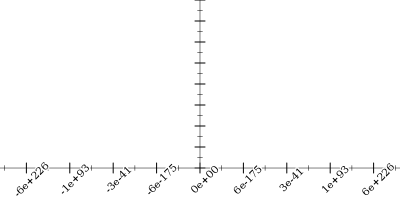
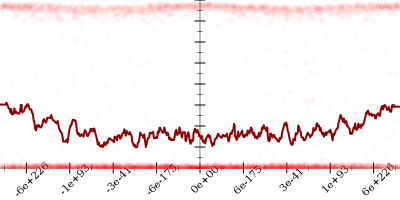
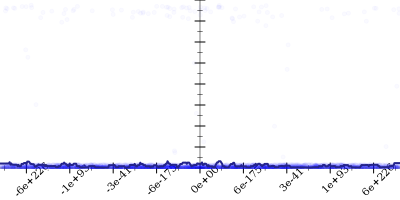
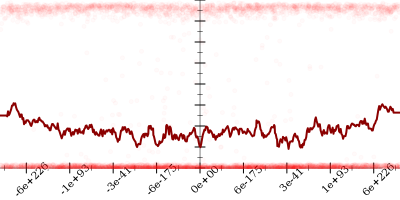
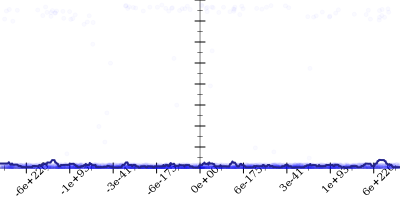
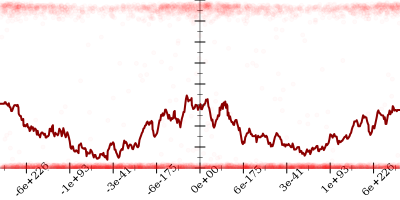
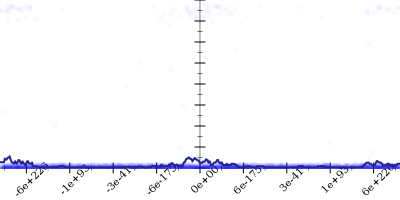
    if (/ (* (/ y z) t) t) < -1.757933118989357e+195

    1. Started with
      \[x \cdot \frac{\frac{y}{z} \cdot t}{t}\]
      40.9
    2. Applied simplify to get
      \[\color{red}{x \cdot \frac{\frac{y}{z} \cdot t}{t}} \leadsto \color{blue}{x \cdot \frac{y}{z}}\]
      16.1
    3. Applied taylor to get
      \[x \cdot \frac{y}{z} \leadsto \frac{y \cdot x}{z}\]
      2.8
    4. Taylor expanded around 0 to get
      \[\color{red}{\frac{y \cdot x}{z}} \leadsto \color{blue}{\frac{y \cdot x}{z}}\]
      2.8

    if -1.757933118989357e+195 < (/ (* (/ y z) t) t) < -7.923790622593908e-262 or 4.0665267137974e-223 < (/ (* (/ y z) t) t) < 5.383776217840303e+282

    1. Started with
      \[x \cdot \frac{\frac{y}{z} \cdot t}{t}\]
      0.5
    2. Applied simplify to get
      \[\color{red}{x \cdot \frac{\frac{y}{z} \cdot t}{t}} \leadsto \color{blue}{x \cdot \frac{y}{z}}\]
      0.2

    if -7.923790622593908e-262 < (/ (* (/ y z) t) t) < 4.0665267137974e-223

    1. Started with
      \[x \cdot \frac{\frac{y}{z} \cdot t}{t}\]
      25.2
    2. Applied simplify to get
      \[\color{red}{x \cdot \frac{\frac{y}{z} \cdot t}{t}} \leadsto \color{blue}{x \cdot \frac{y}{z}}\]
      10.7
    3. Applied taylor to get
      \[x \cdot \frac{y}{z} \leadsto \frac{y \cdot x}{z}\]
      1.3
    4. Taylor expanded around 0 to get
      \[\color{red}{\frac{y \cdot x}{z}} \leadsto \color{blue}{\frac{y \cdot x}{z}}\]
      1.3
    5. Using strategy rm
      1.3
    6. Applied associate-/l* to get
      \[\color{red}{\frac{y \cdot x}{z}} \leadsto \color{blue}{\frac{y}{\frac{z}{x}}}\]
      1.4

    if 5.383776217840303e+282 < (/ (* (/ y z) t) t)

    1. Started with
      \[x \cdot \frac{\frac{y}{z} \cdot t}{t}\]
      57.4
    2. Applied simplify to get
      \[\color{red}{x \cdot \frac{\frac{y}{z} \cdot t}{t}} \leadsto \color{blue}{x \cdot \frac{y}{z}}\]
      25.6
    3. Using strategy rm
      25.6
    4. Applied div-inv to get
      \[x \cdot \color{red}{\frac{y}{z}} \leadsto x \cdot \color{blue}{\left(y \cdot \frac{1}{z}\right)}\]
      25.7
    5. Applied associate-*r* to get
      \[\color{red}{x \cdot \left(y \cdot \frac{1}{z}\right)} \leadsto \color{blue}{\left(x \cdot y\right) \cdot \frac{1}{z}}\]
      2.7

  1. Removed slow pow expressions

Original test:


(lambda ((x default) (y default) (z default) (t default))
  #:name "Graphics.Rendering.Chart.Backend.Diagrams:calcFontMetrics from Chart-diagrams-1.5.1"
  (* x (/ (* (/ y z) t) t)))