\[x \cdot \frac{\frac{y}{z} \cdot t}{t}\]
Test:
Graphics.Rendering.Chart.Backend.Diagrams:calcFontMetrics from Chart-diagrams-1.5.1
Bits:
128 bits
Bits error versus x
Bits error versus y
Bits error versus z
Bits error versus t
Time: 6.3 s
Input Error: 14.4
Output Error: 1.0
Log:
Profile: 🕒
\(\begin{cases} \frac{y \cdot x}{z} & \text{when } \frac{\frac{y}{z} \cdot t}{t} \le -2.2972485982671698 \cdot 10^{+247} \\ x \cdot \frac{y}{z} & \text{when } \frac{\frac{y}{z} \cdot t}{t} \le -2.4461934665936486 \cdot 10^{-155} \\ \frac{y}{\frac{z}{x}} & \text{when } \frac{\frac{y}{z} \cdot t}{t} \le 5.0685428203543285 \cdot 10^{-276} \\ x \cdot \frac{y}{z} & \text{when } \frac{\frac{y}{z} \cdot t}{t} \le 2.1028395862205026 \cdot 10^{+287} \\ \frac{y}{\frac{z}{x}} & \text{otherwise} \end{cases}\)

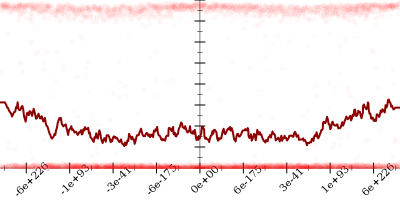
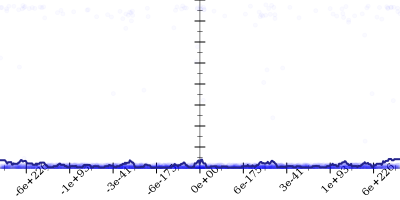
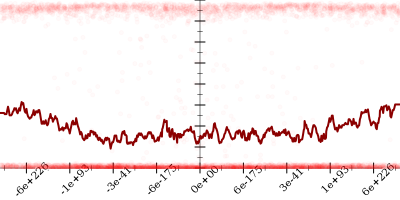
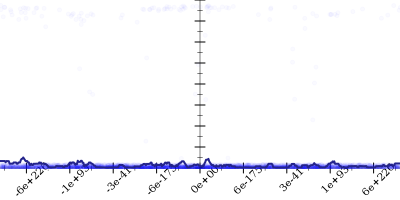
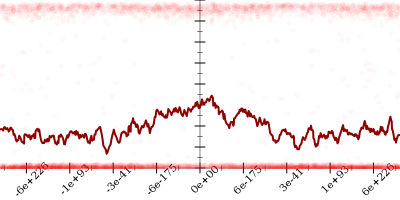
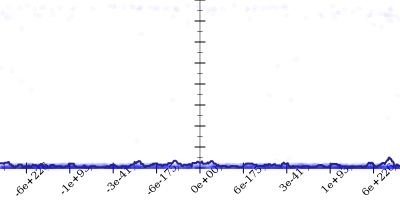
    if (/ (* (/ y z) t) t) < -2.2972485982671698e+247

    1. Started with
      \[x \cdot \frac{\frac{y}{z} \cdot t}{t}\]
      51.6
    2. Applied simplify to get
      \[\color{red}{x \cdot \frac{\frac{y}{z} \cdot t}{t}} \leadsto \color{blue}{x \cdot \frac{y}{z}}\]
      20.9
    3. Applied taylor to get
      \[x \cdot \frac{y}{z} \leadsto \frac{y \cdot x}{z}\]
      2.8
    4. Taylor expanded around 0 to get
      \[\color{red}{\frac{y \cdot x}{z}} \leadsto \color{blue}{\frac{y \cdot x}{z}}\]
      2.8

    if -2.2972485982671698e+247 < (/ (* (/ y z) t) t) < -2.4461934665936486e-155 or 5.0685428203543285e-276 < (/ (* (/ y z) t) t) < 2.1028395862205026e+287

    1. Started with
      \[x \cdot \frac{\frac{y}{z} \cdot t}{t}\]
      0.6
    2. Applied simplify to get
      \[\color{red}{x \cdot \frac{\frac{y}{z} \cdot t}{t}} \leadsto \color{blue}{x \cdot \frac{y}{z}}\]
      0.2

    if -2.4461934665936486e-155 < (/ (* (/ y z) t) t) < 5.0685428203543285e-276

    1. Started with
      \[x \cdot \frac{\frac{y}{z} \cdot t}{t}\]
      22.2
    2. Applied simplify to get
      \[\color{red}{x \cdot \frac{\frac{y}{z} \cdot t}{t}} \leadsto \color{blue}{x \cdot \frac{y}{z}}\]
      9.6
    3. Applied taylor to get
      \[x \cdot \frac{y}{z} \leadsto \frac{y \cdot x}{z}\]
      1.6
    4. Taylor expanded around 0 to get
      \[\color{red}{\frac{y \cdot x}{z}} \leadsto \color{blue}{\frac{y \cdot x}{z}}\]
      1.6
    5. Using strategy rm
      1.6
    6. Applied associate-/l* to get
      \[\color{red}{\frac{y \cdot x}{z}} \leadsto \color{blue}{\frac{y}{\frac{z}{x}}}\]
      1.7

    if 2.1028395862205026e+287 < (/ (* (/ y z) t) t)

    1. Started with
      \[x \cdot \frac{\frac{y}{z} \cdot t}{t}\]
      57.1
    2. Applied simplify to get
      \[\color{red}{x \cdot \frac{\frac{y}{z} \cdot t}{t}} \leadsto \color{blue}{x \cdot \frac{y}{z}}\]
      26.2
    3. Applied taylor to get
      \[x \cdot \frac{y}{z} \leadsto \frac{y \cdot x}{z}\]
      3.9
    4. Taylor expanded around 0 to get
      \[\color{red}{\frac{y \cdot x}{z}} \leadsto \color{blue}{\frac{y \cdot x}{z}}\]
      3.9
    5. Using strategy rm
      3.9
    6. Applied associate-/l* to get
      \[\color{red}{\frac{y \cdot x}{z}} \leadsto \color{blue}{\frac{y}{\frac{z}{x}}}\]
      2.4

  1. Removed slow pow expressions

Original test:


(lambda ((x default) (y default) (z default) (t default))
  #:name "Graphics.Rendering.Chart.Backend.Diagrams:calcFontMetrics from Chart-diagrams-1.5.1"
  (* x (/ (* (/ y z) t) t)))