\[x \cdot \frac{\frac{y}{z} \cdot t}{t}\]
Test:
Graphics.Rendering.Chart.Backend.Diagrams:calcFontMetrics from Chart-diagrams-1.5.1
Bits:
128 bits
Bits error versus x
Bits error versus y
Bits error versus z
Bits error versus t
Time: 5.9 s
Input Error: 14.1
Output Error: 1.0
Log:
Profile: 🕒
\(\begin{cases} \frac{y \cdot x}{z} & \text{when } \frac{\frac{y}{z} \cdot t}{t} \le -5.938455921460385 \cdot 10^{+294} \\ x \cdot \frac{y}{z} & \text{when } \frac{\frac{y}{z} \cdot t}{t} \le -1.6486861915443098 \cdot 10^{-211} \\ \frac{y \cdot x}{z} & \text{when } \frac{\frac{y}{z} \cdot t}{t} \le 4.0176562222098735 \cdot 10^{-247} \\ x \cdot \frac{y}{z} & \text{when } \frac{\frac{y}{z} \cdot t}{t} \le 4.257365925514436 \cdot 10^{+145} \\ \frac{y \cdot x}{z} & \text{otherwise} \end{cases}\)

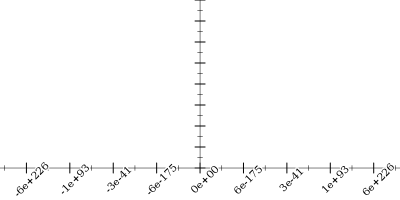
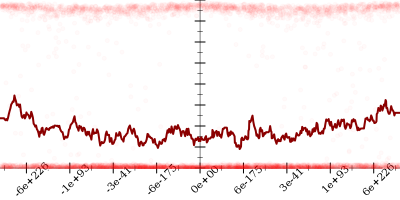
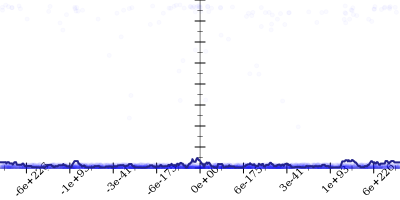
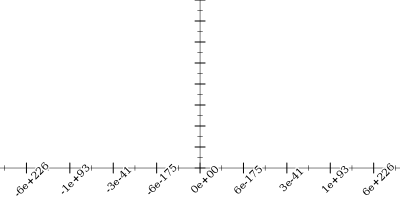
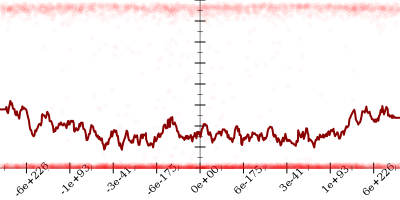
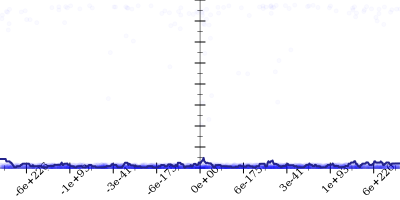
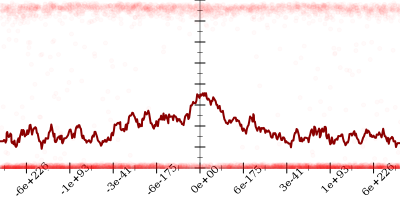
    if (/ (* (/ y z) t) t) < -5.938455921460385e+294 or -1.6486861915443098e-211 < (/ (* (/ y z) t) t) < 4.0176562222098735e-247 or 4.257365925514436e+145 < (/ (* (/ y z) t) t)

    1. Started with
      \[x \cdot \frac{\frac{y}{z} \cdot t}{t}\]
      30.2
    2. Applied simplify to get
      \[\color{red}{x \cdot \frac{\frac{y}{z} \cdot t}{t}} \leadsto \color{blue}{x \cdot \frac{y}{z}}\]
      12.6
    3. Applied taylor to get
      \[x \cdot \frac{y}{z} \leadsto \frac{y \cdot x}{z}\]
      1.9
    4. Taylor expanded around 0 to get
      \[\color{red}{\frac{y \cdot x}{z}} \leadsto \color{blue}{\frac{y \cdot x}{z}}\]
      1.9

    if -5.938455921460385e+294 < (/ (* (/ y z) t) t) < -1.6486861915443098e-211 or 4.0176562222098735e-247 < (/ (* (/ y z) t) t) < 4.257365925514436e+145

    1. Started with
      \[x \cdot \frac{\frac{y}{z} \cdot t}{t}\]
      0.6
    2. Applied simplify to get
      \[\color{red}{x \cdot \frac{\frac{y}{z} \cdot t}{t}} \leadsto \color{blue}{x \cdot \frac{y}{z}}\]
      0.2

  1. Removed slow pow expressions

Original test:


(lambda ((x default) (y default) (z default) (t default))
  #:name "Graphics.Rendering.Chart.Backend.Diagrams:calcFontMetrics from Chart-diagrams-1.5.1"
  (* x (/ (* (/ y z) t) t)))