\[x \cdot \frac{\frac{y}{z} \cdot t}{t}\]
Test:
Graphics.Rendering.Chart.Backend.Diagrams:calcFontMetrics from Chart-diagrams-1.5.1
Bits:
128 bits
Bits error versus x
Bits error versus y
Bits error versus z
Bits error versus t
Time: 7.8 s
Input Error: 14.4
Output Error: 1.6
Log:
Profile: 🕒
\(\begin{cases} \frac{y}{\frac{z}{x}} & \text{when } \frac{\frac{y}{z} \cdot t}{t} \le -4.1645037768149377 \cdot 10^{+126} \\ x \cdot \frac{y}{z} & \text{when } \frac{\frac{y}{z} \cdot t}{t} \le -2.614651003440401 \cdot 10^{-106} \\ \left(x \cdot y\right) \cdot \frac{1}{z} & \text{when } \frac{\frac{y}{z} \cdot t}{t} \le 5.0034931106344 \cdot 10^{-315} \\ x \cdot \frac{y}{z} & \text{when } \frac{\frac{y}{z} \cdot t}{t} \le 7.9228011707214 \cdot 10^{+218} \\ \frac{y \cdot x}{z} & \text{otherwise} \end{cases}\)

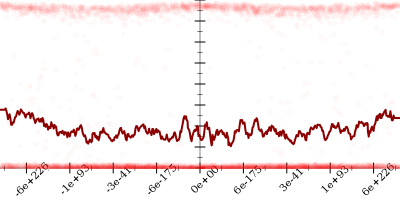
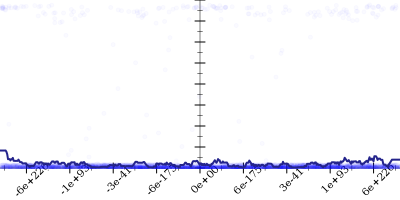
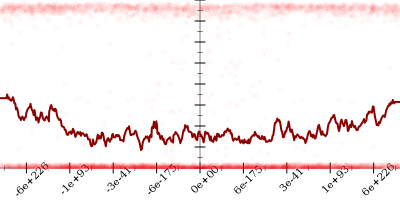
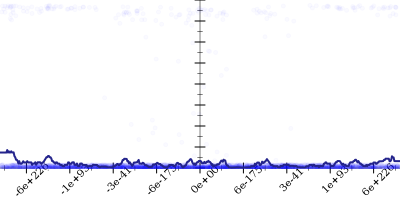
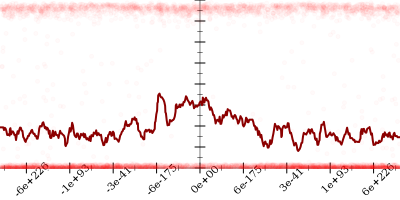
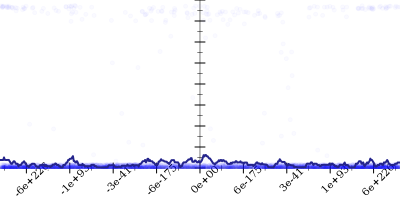
    if (/ (* (/ y z) t) t) < -4.1645037768149377e+126

    1. Started with
      \[x \cdot \frac{\frac{y}{z} \cdot t}{t}\]
      34.6
    2. Applied simplify to get
      \[\color{red}{x \cdot \frac{\frac{y}{z} \cdot t}{t}} \leadsto \color{blue}{x \cdot \frac{y}{z}}\]
      16.2
    3. Applied taylor to get
      \[x \cdot \frac{y}{z} \leadsto \frac{y \cdot x}{z}\]
      3.9
    4. Taylor expanded around 0 to get
      \[\color{red}{\frac{y \cdot x}{z}} \leadsto \color{blue}{\frac{y \cdot x}{z}}\]
      3.9
    5. Using strategy rm
      3.9
    6. Applied associate-/l* to get
      \[\color{red}{\frac{y \cdot x}{z}} \leadsto \color{blue}{\frac{y}{\frac{z}{x}}}\]
      4.5

    if -4.1645037768149377e+126 < (/ (* (/ y z) t) t) < -2.614651003440401e-106 or 5.0034931106344e-315 < (/ (* (/ y z) t) t) < 7.9228011707214e+218

    1. Started with
      \[x \cdot \frac{\frac{y}{z} \cdot t}{t}\]
      0.6
    2. Applied simplify to get
      \[\color{red}{x \cdot \frac{\frac{y}{z} \cdot t}{t}} \leadsto \color{blue}{x \cdot \frac{y}{z}}\]
      0.3

    if -2.614651003440401e-106 < (/ (* (/ y z) t) t) < 5.0034931106344e-315

    1. Started with
      \[x \cdot \frac{\frac{y}{z} \cdot t}{t}\]
      20.5
    2. Applied simplify to get
      \[\color{red}{x \cdot \frac{\frac{y}{z} \cdot t}{t}} \leadsto \color{blue}{x \cdot \frac{y}{z}}\]
      8.5
    3. Using strategy rm
      8.5
    4. Applied div-inv to get
      \[x \cdot \color{red}{\frac{y}{z}} \leadsto x \cdot \color{blue}{\left(y \cdot \frac{1}{z}\right)}\]
      8.5
    5. Applied associate-*r* to get
      \[\color{red}{x \cdot \left(y \cdot \frac{1}{z}\right)} \leadsto \color{blue}{\left(x \cdot y\right) \cdot \frac{1}{z}}\]
      2.1

    if 7.9228011707214e+218 < (/ (* (/ y z) t) t)

    1. Started with
      \[x \cdot \frac{\frac{y}{z} \cdot t}{t}\]
      48.9
    2. Applied simplify to get
      \[\color{red}{x \cdot \frac{\frac{y}{z} \cdot t}{t}} \leadsto \color{blue}{x \cdot \frac{y}{z}}\]
      19.5
    3. Applied taylor to get
      \[x \cdot \frac{y}{z} \leadsto \frac{y \cdot x}{z}\]
      3.3
    4. Taylor expanded around 0 to get
      \[\color{red}{\frac{y \cdot x}{z}} \leadsto \color{blue}{\frac{y \cdot x}{z}}\]
      3.3

  1. Removed slow pow expressions

Original test:


(lambda ((x default) (y default) (z default) (t default))
  #:name "Graphics.Rendering.Chart.Backend.Diagrams:calcFontMetrics from Chart-diagrams-1.5.1"
  (* x (/ (* (/ y z) t) t)))